 Parth Shah
on
Parth Shah
on

Parth Shah
Register Valuer | CA | CPA | 15+ Years of Experiance
Parth Shah is the Founder and Team Leader of the company, bringing extensive expertise in business valuation and financial advisory.
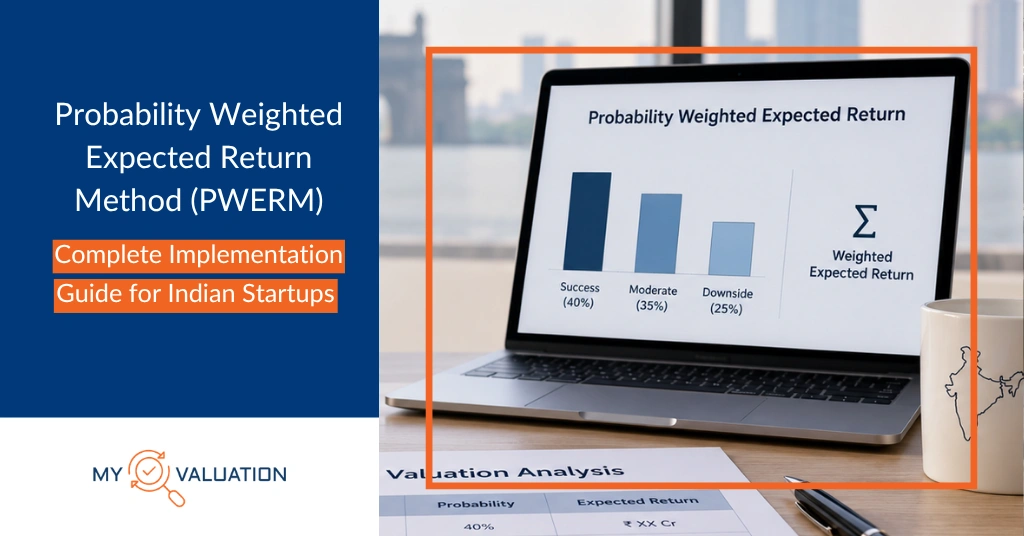
The probability weighted expected return method allocates a company’s equity value across a set of discrete exit scenarios, weights each by how likely it is, and reads off what common stock collects in each one. It is an allocation method. It does not tell you what the company is worth.
That distinction decides whether your report survives audit review. PWERM takes an equity value you have already established and splits it across share classes whose rights differ. Feed it a weak equity value and no amount of scenario modelling will rescue the answer.
This guide covers the mechanics end to end: designing the scenario set, sourcing probabilities an auditor will accept, discounting each scenario at its own rate, and carrying the result into an ESOP strike price. At My Valuation we run this analysis on late-stage cap tables where a specific exit is already in view.
Key Takeaways
- The probability weighted expected return method (PWERM) allocates an already-established equity value across discrete exit scenarios and weights each by its probability. It is an allocation method, not a way of deriving value.
- Four allocation methods sit in the standard toolkit: current value method, option pricing model, PWERM and the hybrid. PWERM is the scenario-based one.
- PWERM fits a company with a visible, dateable exit. OPM fits a company whose exit is three to five years out and undefined.
- Each scenario carries its own discount rate. An IPO eighteen months away does not carry the same risk as a stay-private case four years out.
- Probabilities must trace to documented evidence dated before the valuation date, such as board minutes, a banker’s engagement letter or a received term sheet.
- The allocated common value, after a discount for lack of marketability (DLOM), is what feeds the Ind AS 102 grant-date measurement and anchors the ESOP strike price.
- A PWERM allocation is not the perquisite fair market value certificate required on exercise under Rule 15(6) of the Income-tax Rules 2026. Those are two separate deliverables.
What Is the Probability Weighted Expected Return Method (PWERM)?
PWERM is a method that values each class of shares by modelling specific future exit outcomes, running the payout waterfall inside each one, discounting the results to today, and weighting them by probability. The “waterfall” is simply the order in which proceeds get paid out when a company exits.
The framework comes from the AICPA’s guide on valuing privately held company equity securities issued as compensation, known in practice as the cheap stock guide. Indian valuers apply the same mechanics under Ind AS 113 fair value measurement and the ICAI Valuation Standards.
The logic is deliberately concrete. Instead of assuming outcomes follow a smooth statistical distribution, PWERM asks what actually happens to this company: an IPO, a trade sale, a stay-private case, a downside.
How PWERM differs from the other three allocation methods
Four methods split equity value across share classes. Choosing the wrong one is the single most common finding in a methodology review.
| Method | Core assumption | Best fit | Main weakness |
| Current value method (CVM) | The company exits today at today’s value | Imminent sale, or a very early company with nothing to model | Ignores time value and upside entirely |
| Option pricing model (OPM) | Exit outcomes follow a single continuous distribution | Seed to Series C, exit undefined | Smooths away a specific known event |
| PWERM | A small number of discrete outcomes, each dateable and priceable | Late stage with a visible exit path | Wholly dependent on the probabilities you feed it |
| Hybrid | Discrete near-term scenarios, with a distribution inside the stay-private case | Exit partly visible, partly open | Most build effort and the hardest to document |
Note what PWERM and OPM have in common. Both allocate. Neither derives the equity value they allocate. If you want the allocation mechanics of the alternative, our guide on how the OPM builds a breakpoint schedule and backsolves to equity value covers it in full.
When Should an Indian Startup Use PWERM Instead of OPM?
Use PWERM when a specific exit is close enough that you can name it, date it and price it. Use OPM when the exit is a general expectation rather than a plan.
Three tests decide it in practice.
The stage test. Seed to Series B companies almost never clear the bar. Series D, pre-IPO and companies in an active sale process usually do.
The visibility test. Can you write down an exit value and an exit date for each scenario without inventing both? If the honest answer is “three to seven years, at a multiple we cannot pin down”, PWERM will manufacture false precision.
The evidence test. For each probability, can you point to a document dated before the valuation date that supports it? A banker’s engagement letter, a board resolution approving an IPO process, a received offer. If every probability rests on a conversation, the method is not defensible.
Fail any one test and OPM, or a hybrid, is the better call.
How Do You Build a PWERM? The Six-Step Implementation
The build is mechanical once the inputs are settled. The judgement sits entirely in steps 1, 3 and 5.
Step 1: Define the exit scenarios
Scenarios must be mutually exclusive and collectively exhaustive. Every future the company could reach belongs to exactly one scenario, and the probabilities sum to 100%. Three to five is the working range.
Always include a downside. A scenario set with no dissolution or distressed-sale case systematically overstates common stock, because common is exactly the class that gets wiped out there.
Step 2: Estimate exit value in each scenario
Each scenario needs its own total equity value at the exit date, not today. An IPO scenario prices off listed peer multiples applied to the revenue the company expects to reach by listing. A trade sale prices off precedent transactions in the same segment.
Build these from the board-approved operating plan, then sanity-check the multiples against Indian market data. An Indian SaaS listing and a Nasdaq listing do not clear at the same multiple.
Step 3: Fix the timing of each scenario
Timing drives the discounting, so it does more work than most people expect. A four-year stay-private case at a 40% rate loses roughly three quarters of its value before weighting.
Anchor timing to something external: a DRHP timetable, a signed mandate letter, a board-approved exit horizon. “Management expects three years” written on the valuation date is not evidence.
Step 4: Run the liquidation waterfall inside each scenario
In each scenario, walk the proceeds down the preference stack and decide, class by class, whether the holder takes its liquidation preference or converts to common. A non-participating holder takes whichever is higher, and that comparison flips between scenarios. Capturing those flips is the whole point of the method.
Build the stack from the signed shareholders’ agreement, because how CCPS liquidation preference and conversion terms are drafted rarely survives summarisation into a cap table sheet. Model that stack as it will exist at exit, not today. A bridge round planned before the IPO belongs in the IPO scenario.
Step 5: Discount each scenario at its own rate, then apply DLOM
Every scenario gets a rate matched to its own risk and horizon. A banker-led IPO eighteen months out is a lower-risk cash flow than a speculative sale four years out. One blended rate across all scenarios either flatters the downside or punishes the near-term case, and reviewers catch it quickly.
Apply the discount for lack of marketability after allocation, never as a substitute for it. DLOM reflects that private shares cannot be sold on demand. It is not a place to park modelling discomfort.
Step 6: Probability-weight and reconcile
Multiply each scenario’s present value per share by its probability and add them up. Then reconcile: the sum of all classes’ weighted values should tie back to the weighted total equity value. If it does not, a waterfall is wrong.
A Worked PWERM Example: Four Exit Scenarios for a Pre-IPO Indian Company
Consider an anonymised Chennai-based enterprise software company preparing for a domestic listing. The cap table has one crore fully diluted shares.
The stack: 70,00,000 common shares; a 10,00,000 option pool at a ₹40 strike; Series A CCPS of 10,00,000 shares carrying a ₹20 crore 1x non-participating preference; and Series B CCPS of 10,00,000 shares carrying a ₹50 crore 1x non-participating preference, senior to Series A. Series B was issued at ₹500 per share, so the headline post-money valuation is ₹500 crore.
The board has approved an IPO process, a merchant banker has been mandated, and a strategic buyer has made an informal approach. That evidence base is what makes PWERM appropriate here.
| Scenario | Exit equity value | Timing | Probability |
| IPO | ₹1,200 crore | 2.0 years | 30% |
| Strategic sale | ₹450 crore | 1.5 years | 35% |
| Stay private, later exit | ₹300 crore | 4.0 years | 25% |
| Distressed sale | ₹45 crore | 1.0 year | 10% |
Now run the waterfall in each one. Each exit equity value above is stated before option exercise, so exercise proceeds are added back where the options are in the money. In the IPO scenario, listing forces conversion, so every class shares pro rata and common collects ₹1,204 per share once the ₹4 crore of option exercise proceeds are added back.
In the ₹450 crore strategic sale, Series B weighs its ₹50 crore preference against ₹45.4 crore as converted and takes the preference. Series A does the opposite: ₹20 crore against ₹44.9 crore as converted, so it converts. Common collects ₹448.9 per share. The stay-private case follows the same pattern at lower values, giving ₹282.2. In the ₹45 crore distressed sale, Series B’s preference absorbs everything and common collects nothing.
| Scenario | Common at exit | Discount rate | PV per share | Weighted |
| IPO | ₹1,204 | 25% | ₹770.6 | ₹231.2 |
| Strategic sale | ₹448.9 | 30% | ₹302.9 | ₹106.0 |
| Stay private | ₹282.2 | 40% | ₹73.5 | ₹18.4 |
| Distressed sale | ₹0 | n/a | ₹0 | ₹0 |
| Total | ₹355.6 |
That ₹355.6 is a marketable value. Apply a 22% discount for lack of marketability and the defensible common share value is approximately ₹277 per share.
Compare that against the shortcut. Dividing the ₹500 crore post-money by one crore shares gives ₹500 per share for everyone, about 80% above the PWERM result. The gap is not conservatism. It is what the shareholders’ agreement says, expressed in numbers.
Notice too that the 10% distressed scenario contributes nothing to the total, yet it removes roughly ₹40 of marketable value, about ₹31 after the marketability discount, by occupying probability that would otherwise sit in a paying scenario. Dropping it and spreading that 10% across the three paying scenarios would have lifted the marketable value to about ₹395 and the final figure to about ₹308.
Does your scenario set stand up to auditor review?
We build scenarios from documented exit evidence, apply the shareholder waterfall and record the basis for each probability used.
Explore Complex Financial Instrument ValuationWhere Do PWERM Probabilities Come From, and How Do You Defend Them?
Probabilities come from dated evidence about the company’s exit path, not from management’s confidence level. This is the weakest link in most PWERM reports and the first thing a reviewer tests. Five sources carry weight in an Indian engagement:
- Board minutes recording an exit discussion, a mandate approval or a decision to defer
- A signed engagement letter with a merchant banker or investment bank, and the timetable inside it
- Received term sheets or expressions of interest, including ones that lapsed, since a lapsed offer is evidence about both the upside and the downside
- The company’s own operating plan, approved by the board, for the revenue path each scenario assumes
- Market base rates for how often companies at this stage and in this segment actually list, sell or fold, used as a sanity anchor rather than a source
Apply one test before you finalise the set: for every probability, name the document and its date. If a probability has no document behind it, move the weight into a scenario that does.
Two behavioural traps recur. Management optimism pushes IPO probability above base rates, and the downside gets a token 5% because a larger number feels disloyal. Both inflate common stock, and both are visible to anyone who reads the assumptions against the evidence file.
What Is the Hybrid Method, and When Does It Beat Pure PWERM?
The hybrid method runs PWERM for the near-term scenarios you can actually specify, and an OPM inside the stay-private scenario where the outcome stays diffuse. It is usually the right answer when the exit is half visible.
The reasoning is clean. IPO and trade sale scenarios have dates and prices, so discrete modelling suits them. The stay-private case does not. It is a company continuing to operate with an undefined future, which is what the OPM’s lognormal assumption was built to handle.
In the worked example, the 25% stay-private branch is the obvious candidate. What it does to common value is less predictable than it looks. Common sits between two breakpoints here. It collects nothing below the ₹50 crore Series B preference, and it surrenders part of the upside above roughly ₹500 crore, where Series B converts and the common share of the residual falls from 78% to 70%. Volatility adds value at the lower kink and removes it at the upper one. Whether the branch value rises or falls depends on the volatility and term you assume, so treat any movement as a result you have to explain rather than an expected lift.
The switch also changes the discounting. The 40% rate on that branch was compensating for risk sitting in a single point estimate. An OPM prices much of that same risk through the volatility input, so carrying the 40% across unchanged risks counting it twice. Either allocate at the exit date and discount back at a rate that no longer carries what the volatility now captures, or run the OPM off a current equity value and let the risk-free rate and term do the work.
The cost is documentation. A hybrid report has to justify the scenario split, the OPM inputs inside that one branch, the volatility and term behind them, and why that branch alone was treated differently.
How Does PWERM Output Flow Into Your Ind AS 102 Charge and ESOP Strike Price?
The allocated common value, after DLOM, is the evidence a board relies on when it fixes the ESOP exercise price. In the worked example that is ₹277 per share, not ₹500. Note that Rule 12(3) of the Companies (Share Capital and Debentures) Rules 2014 gives an unlisted company freedom to set the exercise price in conformity with its accounting policies. India has no equivalent of the US 409A safe harbour, so there is no statutory rule that the strike must equal fair market value. What the PWERM number does is make the board’s chosen price defensible rather than arbitrary.
It then becomes an input, not an output. That ₹277 is the underlying share price fed into the option pricing model used to value the options themselves for the grant-date fair value measurement under Ind AS 102. Two separate models running in sequence, serving two different questions. The allocation date and the grant date have to line up, or the allocation has to be rolled forward, because Ind AS 102 measures at grant date and a PWERM struck three months earlier is not a grant-date input.
Which model values the option is a separate decision from which method allocated the equity. That choice turns on vesting structure and exercise pattern, and our comparison of choosing between Black-Scholes, binomial and Monte Carlo for the option itself sets out the trade-offs.
Here is where finance teams get caught. The Ind AS 102 measurement is not the certificate required for perquisite tax on exercise. Under Rule 15(6) of the Income-tax Rules 2026, read with Section 17(1)(d) of the Income-tax Act 2025, the fair market value of unlisted shares must be certified by a SEBI-registered Category I merchant banker as at the specified date, which is the exercise date itself or an earlier date falling no more than 180 days before it. The window runs backwards only. A report dated after the exercise does not qualify, however recent it is, and a chartered accountant cannot sign this particular one.
A PWERM allocation prepared for accounting purposes does not satisfy that rule. Nor does it set a pricing floor under FEMA where a non-resident employee is involved. That floor comes from Rule 21(2)(a)(ii) of the Non-Debt Instruments Rules 2019 and needs a certificate from a chartered accountant, a SEBI-registered merchant banker or a practising cost accountant, which is a different list again. Each purpose carries its own date convention and its own signing authority, which is why the separate certificates each Indian regulator expects on an ESOP should be scoped before any modelling begins.
What Goes Wrong: Seven PWERM Mistakes That Fail Audit Review
These seven account for most of the findings we see on inherited PWERM reports.
- Scenarios that overlap or leave gaps. If a “strategic sale” and an “acquihire” case describe the same transaction, weight is double counted. Probabilities must sum to exactly 100% across mutually exclusive outcomes.
- One blended discount rate for every scenario. A near-term IPO and a speculative four-year case do not share a cost of capital.
- Probabilities sourced from optimism. A 60% IPO weighting with no banker mandate and no board resolution behind it will not hold.
- No downside scenario. Omitting dissolution or a distressed sale removes the only case where common is worth nothing, which inflates every weighted result.
- Today’s cap table applied at a future exit. Planned bridge rounds, pool top-ups and anti-dilution adjustments change the waterfall by the exit date.
- Double counting risk. Assigning a low probability to a scenario and then discounting that same scenario at a punitive rate charges for the same risk twice.
- Treating the allocation as a compliance certificate. A PWERM output is neither the merchant banker’s exercise-date FMV certificate nor a FEMA pricing floor.
Which of these seven appears in your latest valuation report?
Our IBBI Registered Valuers review the scenarios, probability assumptions and waterfall to identify what holds up and what may need rework.
See Our ESOP Valuation ServicesConclusion: Getting Your Probability Weighted Expected Return Method Implementation Right
The probability weighted expected return method earns its place when a company’s exit is close enough to name, date and price. It allocates an established equity value across those outcomes and shows what common stock actually collects in each one. Get the scenarios and probabilities right and the arithmetic follows. Get them wrong and every downstream number, from strike price to accounting charge, inherits the error.
Four things to act on:
- Tie every probability to a dated document before you finalise the weights, not after the auditor asks.
- Give each scenario its own discount rate, matched to that scenario’s horizon and risk.
- Keep the allocation and the merchant banker’s exercise-date certificate as two deliverables, on two dates, under two signing authorities.
- Re-run the scenario set the moment the exit facts change, because a withdrawn mandate or a new offer resets every weight in the model.
Get those four right and your allocation stops being the section of the report you brace for.
Ready to decide between OPM, PWERM and a hybrid for your next report?
Speak with an IBBI Registered Valuer about the right allocation method for your cap table and exit assumptions.
Book a Free Consultation with an IBBI Registered ValuerFrequently Asked Questions
1. What is PWERM in valuation?
PWERM, the probability weighted expected return method, allocates a company’s equity value across share classes by modelling discrete exit scenarios, running the payout waterfall in each, discounting to present value and weighting by probability.
2. Is PWERM a valuation method or an allocation method?
It is an allocation method. PWERM distributes an equity value that has already been established through an income, market or asset approach. It does not derive that value itself.
3. When should a startup switch from OPM to PWERM?
Switch when a specific exit becomes visible enough to name, date and price, typically once a banker is mandated, an IPO process is board-approved or a credible offer is on the table. Before that point OPM is more defensible.
4. How many scenarios should a PWERM have?
Three to five is the working range, and one of them must be a downside. Two scenarios rarely capture the preference stack. Six or more usually means you are modelling variations of the same outcome.
5. Where do PWERM probabilities come from?
From dated evidence: board minutes, a signed banker engagement letter, received term sheets and the board-approved operating plan. Market base rates for listings and trade sales serve as a sanity check, not as the source.
6. What discount rate applies to each PWERM scenario?
Each scenario carries its own rate, matched to its risk and horizon. A near-term banker-led IPO warrants a materially lower rate than a speculative multi-year stay-private case. A single blended rate across all scenarios is a methodology error.
7. Can a PWERM be used for ESOP perquisite tax in India?
No. Perquisite fair market value on exercise of unlisted shares must be certified by a SEBI-registered Category I merchant banker under Rule 15(6) of the Income-tax Rules 2026, dated within 180 days of exercise. A PWERM allocation prepared for accounting does not substitute for it.
8. Does PWERM always give a higher common share value than OPM?
No. The direction depends entirely on the scenario set. A PWERM weighted toward a near-term high-value IPO will usually exceed an OPM result, while one carrying a meaningful distressed case can fall below it.
Related Reading
- ESOP Valuation in India: Methods, Rules, Taxation & Compliance Guide (2026)
- Ind AS 102 Share-Based Payments: How to Calculate ESOP Expense for Your P&L
- Black-Scholes vs Binomial vs Monte Carlo: Which ESOP Valuation Model Is Best for Indian Startups?
- Cap Table Management: 10 Common Founder Mistakes and How to Avoid Them